

by Daniel Ralph, Andrew Coburn, Jennifer Copic, Simon Ruffle, Michelle Tuveson
The 2018 version of the Cambridge Global Risk index sees risk up, with expected loss increasing to 1.54% of the world’s 2018 GDP, compared to last year’s index of 1.48% of 2017 GDP. This change is largely driven by an increase in geopolitical risks, which have increased by 16% year-on-year, as a result of increased likelihoods of civil conflict, interstate war, terrorism, and social unrest around the world. Trends such as trade wars, the loosening of military alliances, increased belligerence by three super-powers, and democratic popularism increase the likelihood for disruption of the global economy.
The Cambridge Centre for Risk Studies continues to develop novel ‘Catastronomics’ techniques to analyse the economic impact of man-made and natural catastrophes. Our Cambridge Global Risk Index 2018 (GRI 2018) applies these techniques at the city level to estimate the gross domestic product at risk (GDP@Risk) inflicted by each of 22 threats on each of 279 cities. The GRI cities represent the world’s leading metropolises, which together generate 41% of global GDP.
The Index estimates that global GDP@Risk exceeds $540 billion, which is the total GDP@Risk of all cities to all threats in the Index. This is around 1.6% of annual global GDP which is significant when compared to nominal growth in world GDP of 3.8% per annum.
The Global Risk Index is unique as a platform for quantifying and comparing city risk exposures across a panoply of “macro threats”, some of which are considered traditional (e.g., earthquakes and floods), while others, though similarly biblical, inspire different kinds of terror: pestilence and war. Market crash and various technology shocks like cyber attack have special relevance in today’s world which relies on huge movements of goods and money across national boundaries. The 2015 GRI accomplished a world first in putting these macro threats, and many others, onto the same page via GDP@Risk. The relevance and robustness of the Index is confirmed in the 2018 update.
The Cambridge Global Risk Index makes the point that unpredictable shocks are indeed foreseeable in terms of their impacts. Effectively, the GRI is the writing on the wall for transparency in risk exposure. Think of a risk index that you build for your organisation which generates quarterly exposure numbers, aggregated across all unpredictable harms. That may seem like a dream today but sleep on it – tomorrow is coming faster than we imagine.
The 2018 update of the GRI is a collaboration with Lloyd’s and launched on 6 June 2018 as the “Lloyd’s City Risk Index”. You can find out more about Lloyd’s City Risk Index 2018 here.
Key Findings
The GRI groups threats into five classes: Natural Catastrophes; Financial, Economics and Trade; Technology and Space; Geopolitics and Security; and Health and Humanity with the Natural Catastrophes having the highest overall loss. From 2015 to 2018, increases in GDP across the world have led to increases in GDP@Risk in each of these threat classes. Geopolitics and Security has grown faster than other threat classes – more on that below.
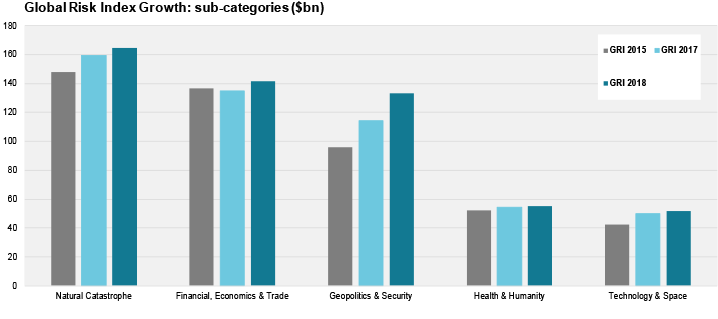
Figure 1: Global Risk Index 2018 Growth by Sub-Categories ($bn).
The largest individual threats globally[1] are: market crash ($103 bn), interstate conflict ($80 bn) and tropical windstorm ($63 bn). Man-made threats account for 59% of the total GDP@Risk. Climate-related risks account for $123 bn of lost GDP – a sum that will grow as extreme events increase in frequency and severity – which is 23% total GDP@Risk.
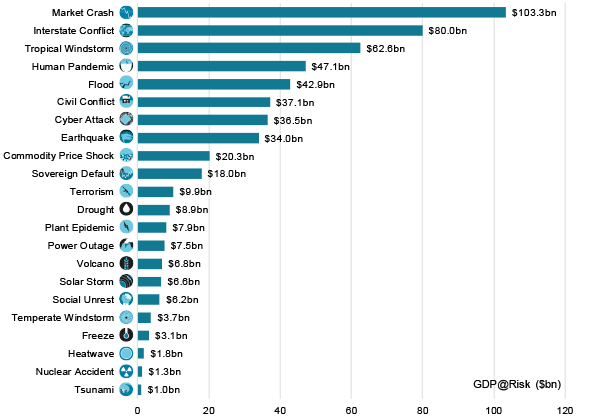
Figure 2: Global Risk Index 2018 Threat Rankings.
The 10 cities with the highest exposure together represent economic losses of $127 bn per annum, almost a quarter of global GDP@Risk, with the Tokyo metropolis at greater risk than any other city.
Rising risk in Geopolitics and Security threats
Geopolitics and Security, which covers Interstate Conflict, Civil Conflict, Terrorism and Social Unrest, has grown more rapidly than other threat classes in recent years. Since 2015, global GDP@Risk for Geopolitics and Security has increased by nearly 40%. More than half of that increase is due to greater instability on a global scale, leading to heightened (but still minute) chances of interstate and civil conflicts and social unrest. The rest of the increase follows from GDP growth since 2015. See Figure 3. The growth in risk in Geopolitics and Security reflects threats to international trade agreements and uncertainty in foreign policy of leading nations. This is mirrored in 2016 political shocks such as the US presidential election and UK Brexit vote, subsequent foreign and trade policy bombshells from the US administration, and ongoing challenges by populist political leaders to the established parties throughout Europe.
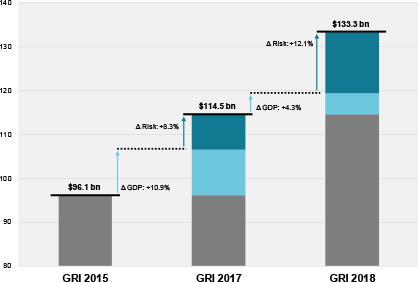
Figure 3: Change in Geopolitics & Security GDP@Risk ($bn) in 2015.
GDP@Risk is an average, not a worst case, number
GDP@Risk associated with a given city, across all threats, is not a “worst case” economic loss. It combines the size of losses with their likelihoods to estimate average annual loss. It can be thought of as the amount of money that the city would have to be put aside each year to cope with all disasters it will face over time. The 2018 update is calculated using data up to the end of 2017 including projections of GDP in 2018 and beyond, to incorporate economic recovery over time from shocks in the various threat classes.
City resilience
The initial impact of a shock event on a city and the subsequent rate of recovery are key parts of the methodology for assessing GDP@Risk of a city. The methodology consolidates a number of hard and soft factors – some from the INFORM Index for Risk Management – from physical infrastructure and measures of wealth to measures of strength of Governance, Access to Healthcare, Inequality and so on. Cities such as Tokyo, London, Singapore and Abu Dhabi represent the most resilient cities while Baghdad, Delhi, Tripoli, and Port-Au-Prince rank amongst the least resilient. We estimate that stronger resilience in future could prevent around half of the total GDP@Risk.
Key Model updates
This is the third update for this index (see 2015 and 2017 update). Key model improvements for GRI 2018 include: reviewing the threat landscape for a three-year horizon, grouping cities into metropolitan areas as this better reflects the economic boundaries rather than narrow administrative definitions, and engineering a robust rate of recovery for each city. More information on the methodology of the GRI Index can be found in “Cambridge Global Risk Outlook 2018 Methodology” (made public June 6, 2018).
Summary
The Cambridge Global Risk Index is a unified approach for quantifying shocks to the global economy from systemic events. Further, the underlying analytics provide a methodology to quantify the economic value of improvements in city resilience; this has significance for governments, infrastructure providers and insurers, and development organisations.
Beyond city risk exposure, the big opportunity posed by the GRI is the potential for any organisation to quantify its exposure to “all threats” that are material to its health and development.
You can find out more about the Cambridge Global Risk Index research track here. The Lloyd’s City Risk Index 2018 is available to download here.
[1] When the term global is used it refers only to the 279 cities in the Index, not all cities in the world.

Daniel Ralph
Managing the rising threat of geopolitical risks - Enterprise RiskEnterprise Risk
[…] risks are posing an increasing threat to the global economy, according to the 2018 update of the Cambridge global risk index, which shows a rise of 16 per cent year-on-year thanks to the increasing likelihoods of civil […]